We tested 33 trading ideas. 27 didn’t make it.
ArchiBalt researches strategies for US index CFDs. Buy access to what’s left, with its rules, its live signals and every known weakness on the record.
Five strategies, two ideas.
Six notebooks had evidence, and they became these five. Four trade the rebound after a US sell-off and one trades the Fed calendar. The rebound versions often fire on the same days, so buying more of them adds less than the count suggests.
Trust is the verdict of each strategy’s report card in the app. Low means important checks fail, so the backtest alone is not good evidence: paper or demo only. Medium means every backtest check passes, and it still has to be confirmed on new data.
Backtests on Capital.com hourly prices, May 2017 to October 2026, after spread and swap. All five curves use the same scale. 1 bp is 0.01 %. Figures are on the amount traded, before any leverage. Backtests are not future returns.
See every year, including the losing ones
| Strategy | 2017 | 2018 | 2019 | 2020 | 2021 | 2022 | 2023 | 2024 | 2025 | 2026 |
|---|---|---|---|---|---|---|---|---|---|---|
| PRE-FOMC-US | −0.0 | +2.8 | −0.2 | +3.6 | −1.5 | +7.6 | +1.3 | +2.3 | +0.6 | −1.6 |
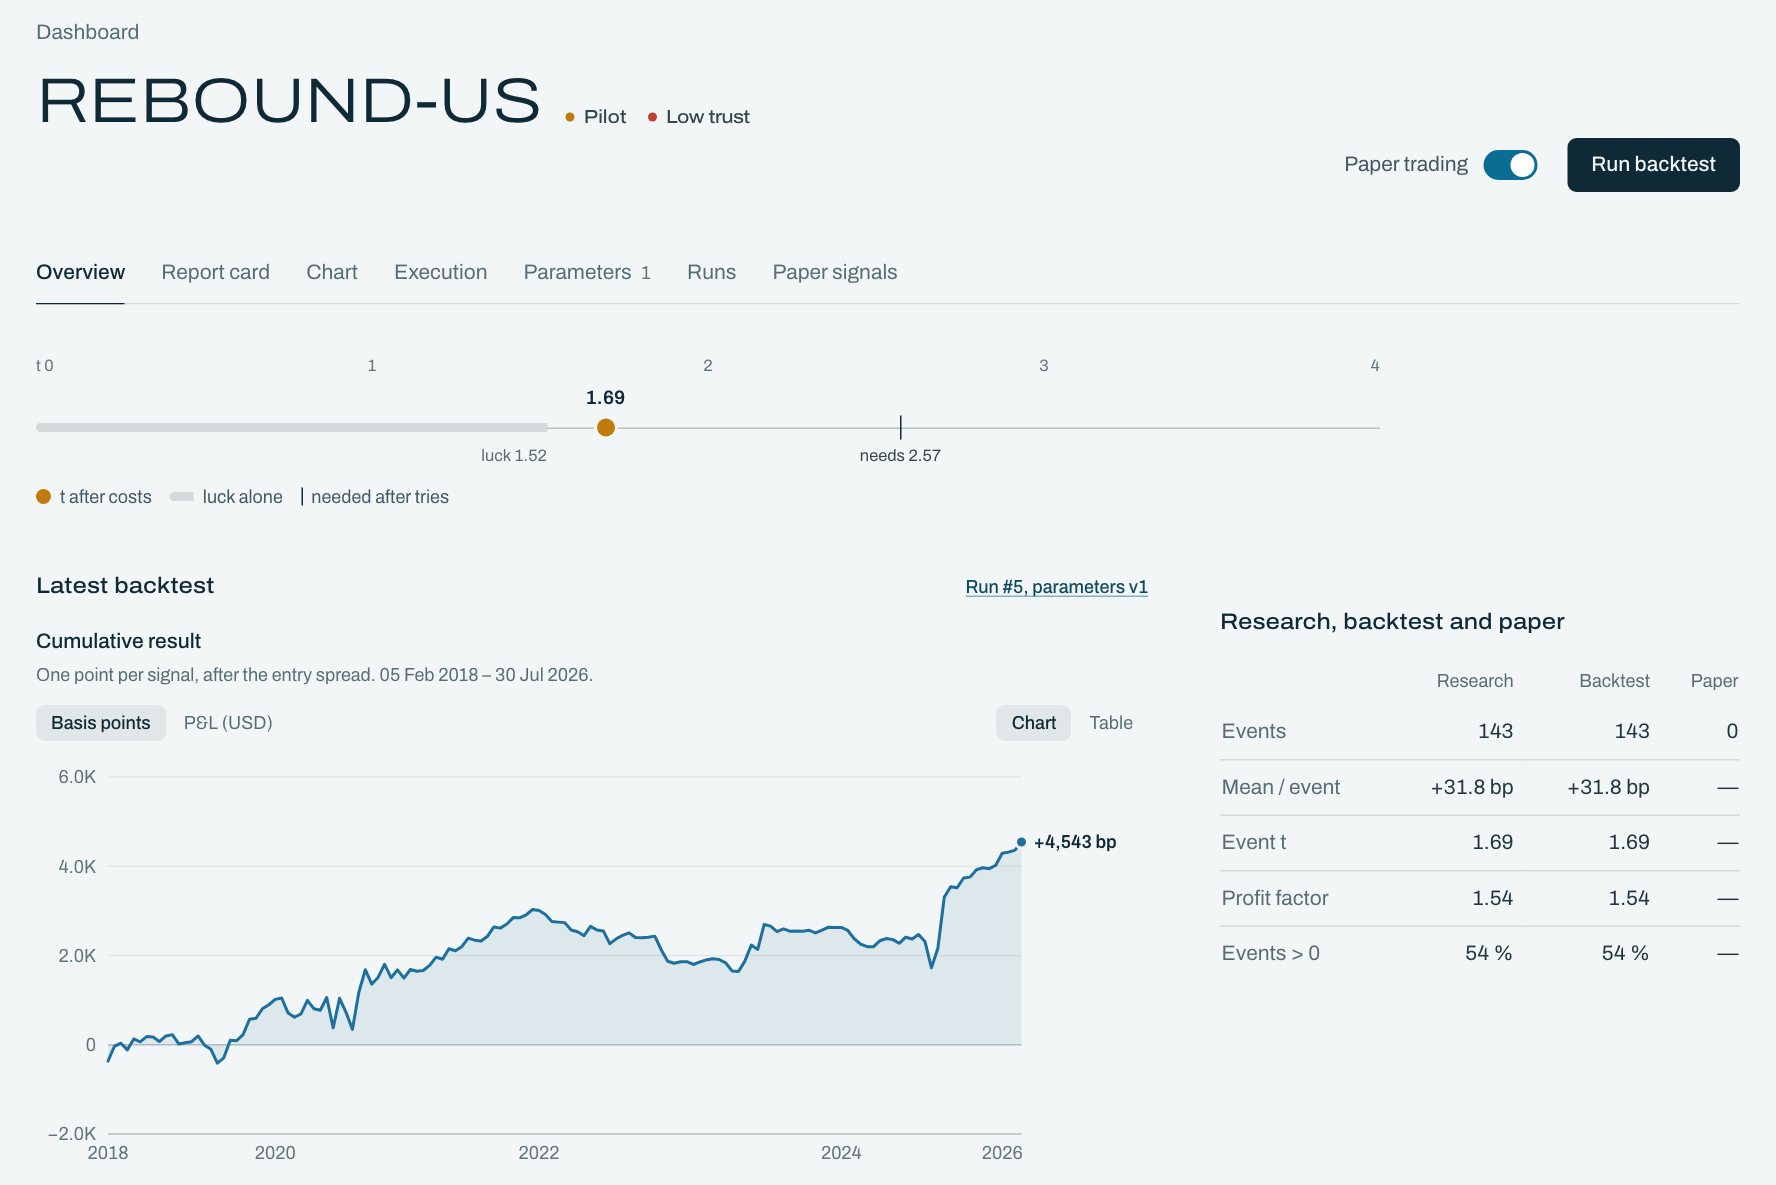
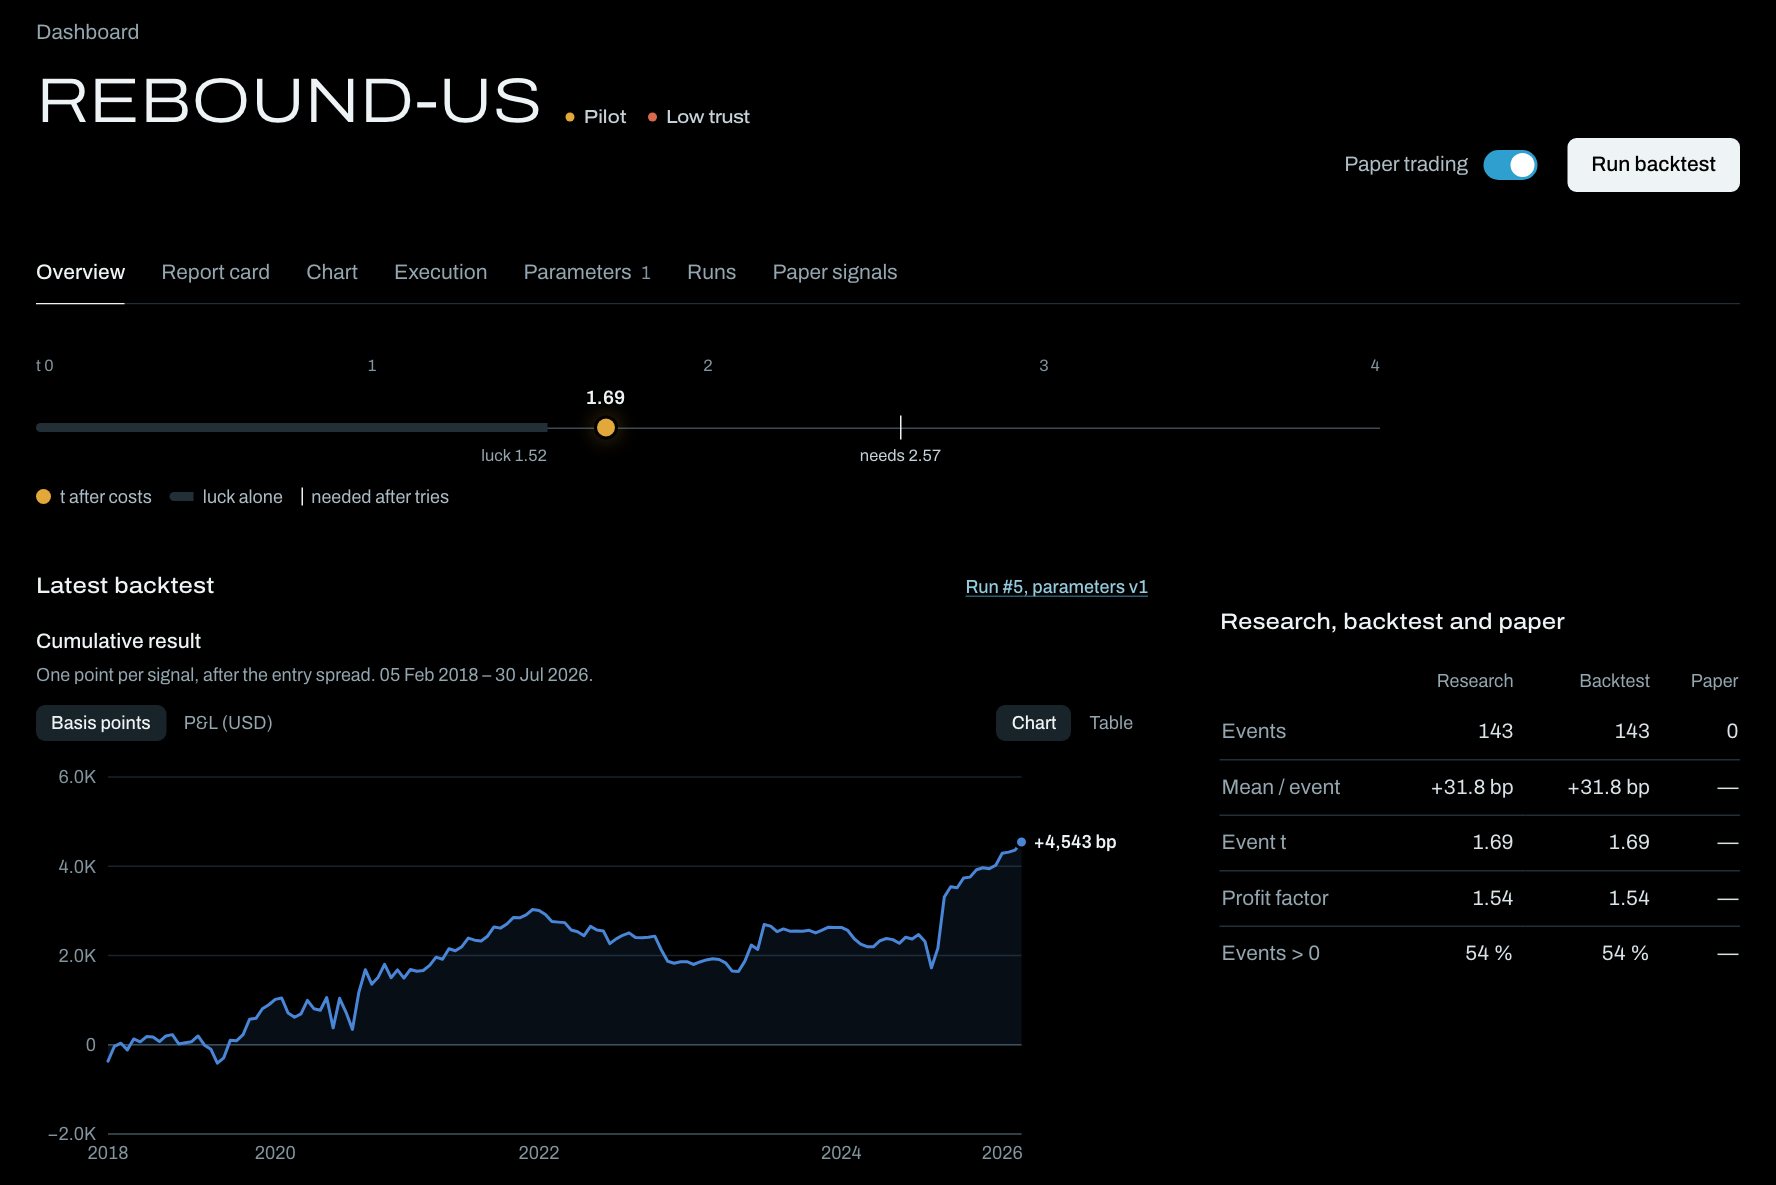
| REBOUND-US | none | −2.9 | +11.9 | +14.3 | +7.1 | −4.3 | +0.3 | −2.7 | +16.7 | +5.2 |
| REBOUND-US-CASH | none | +0.6 | +4.1 | +29.1 | +4.5 | +6.0 | −0.4 | +3.3 | +20.2 | +0.6 |
| Rebound, early entry | none | −5.3 | +10.5 | +18.7 | +8.0 | −5.6 | +0.0 | −2.4 | +14.4 | +6.2 |
| Rebound, cash-close signal | none | −8.9 | +12.8 | +12.0 | +2.9 | −9.6 | −0.8 | +0.6 | +17.7 | +2.1 |
All 5 strategies $10,000 a year $2,000 each
Request accessWhat you get for each one.
Your own ArchiBalt workspace, where each strategy you choose runs on live prices next to the evidence for it.
ArchiBalt never trades real money. If you act on a signal, you place that trade yourself, at your own broker.
- The exact rules
- Entry, exit, markets and sizing, in plain words. They are not on this page because they are what you are buying.
- Live signals
- The engine checks prices every hour and tells you by Telegram or email when a signal fires.
- The full research
- The report behind each strategy, with its charts, its tests and what it failed.
- A report card
- Whether to believe the backtest: neighbouring settings, higher costs, and how many tries it took.
- A paper record you can check
- Every signal and trade on live prices, with monthly statements and CSV exports.
- Demo orders, if you want them
- Send the trades to a Capital.com demo account, with limits and a kill switch. Virtual money only.
We make it hard for our own strategies to look good.
The bar rises with every try.
Test 31 ideas and one will look good by luck, so each variant we try raises the bar. PRE-FOMC-US reached t 2.53. As our 31st idea it needed 3.04, and it has not got there.
Failures stay on the record.
All 27 are still in the research log with their results. You can read every one of them on the rail at the top of this page.
Every number is after costs.
The spread of the entry candle comes off every trade, plus a night of swap where a position stays overnight. An edge that only exists before costs does not count.
The live engine has to match the report.
A strategy goes live only if the engine that trades it reproduces its research. One example: 151 events, +19.1 bp, t 1.08 in the report, and the same three numbers on the engine.
Read all 33 notebooks
| Notebook | Outcome | Idea | Result |
|---|---|---|---|
| S001 | Rejected | Close vs EMA12 on the first candle of the session, exit after 3 candles | 12 061 trades, win rate 37.1 %, PF 0.51 |
| S002 | Rejected | S001 + strong first-candle filter | 3 794 trades, PF 0.51 |
| S003 | Rejected | S002 + smaller back tail | 1 594 trades, PF 0.52 |
| S004 | Rejected | S002 + no tail on the open side | 231 trades, PF 0.42 |
| S005 | Rejected | S001–S004 on 15-minute candles | PF 0.37–0.58 |
| S006 | Rejected | S003 with EMA length 7–26 | PF 0.49–0.55 |
| S007 | Rejected | S004 with EMA25 | 204 trades, PF 0.48 |
| S008 | Rejected | Asian-range breakout at the London open | 3 515 trades, PF 0.97 |
| S009 | Not for CFDs | Intraday momentum: the last hour follows the day (Gao et al. 2018; Baltussen et al. 2021) | 7 141 trades, +1.8 bp before spread, PF 0.99 |
| S010 | Not for CFDs | Overnight drift: long US500 02:00–03:00 ET (Boyarchenko et al. 2023) | 2 347 trades, +0.54 bp before spread, PF 0.79 |
| S011 | Not for CFDs | Time-series momentum, 12 months (Moskowitz, Ooi, Pedersen 2012) | Sharpe 0.70 before costs, 0.32 with a 3 % swap |
| S012 | Not for CFDs | Time-series momentum with real Capital.com swaps | Sharpe −0.08 after swaps (0.38 as futures) |
| S013 | Rejected | Overnight drift after a US500 sell-off, tested on Europe | −2.4 bp per trade after spread |
| S014 | Rejected | Rebound, daytime session only (09:00–16:00 ET) | +12.2 bp, t 1.49; without 2020 +1.8 bp; Europe −6.3 bp |
| S015 | Rejected | S008 + volatility filter | out-of-sample −0.013 % vs −0.011 % without the filter |
| S016 | Evidence | Rebound on daily data | +21.0 bp, PF 1.35; 2000–2016 +22.7 bp |
| S017 | Evidence | Rebound on hourly candles | +31.9 bp, PF 1.52, event t 1.69 |
| S018 | Rejected | Same signal on 32 other markets | Non-US indices −16.9 bp and energy −31.5 bp before spread; only US2000 +17.2 bp after costs (t 1.69) |
| S019 | Rejected | Logistic regression + dense neural net | Out-of-sample AUC 0.494 / 0.505 |
| S020 | Rejected | Short "catch-up" basket after a US500 sell-off | +18.4 bp per event (t 3.03), but 2017–2026 +9.2 bp (t 0.74) |
| S021 | Rejected | Short energy after a US500 sell-off | −0.6 bp (t −0.02); +13.5 bp (t 0.36) |
| S022 | Evidence | Rebound under three signal definitions | +16.3 / +31.7 / +16.8 bp per event, t 0.93 / 1.74 / 0.94 |
| S023 | Analysis only | US100 in the rebound: special market or beta? | US100 − US500 = +0.012 σ (t 0.36): mostly beta |
| S024 | Rejected | ML filter (ridge, gradient boosting) for the rebound | Filter −1.5 bp vs always trading |
| S025 | Rejected | Turn-of-the-month effect (McConnell, Xu 2008) | −3.2 bp after spread and swap |
| S026 | Rejected | "Tech-led sell-off" condition for US100 | Group difference −0.027 σ (t −0.38) |
| S027 | Rejected | Rebound only in the top quintile of a ridge forecast | +55.4 vs +7.6 bp (t 1.37), no better than a plain filter |
| S028 | Evidence | Drift before scheduled Fed statements (Lucca, Moench 2015) | +19.9 bp per event after costs (t 2.53); 2023–2026 +8.7 bp (t 0.84) |
| D001 | Evidence | Rebound with a delayed entry | +31.8 bp, PF 1.53 |
| D002 | Rejected | Small transformer on daily bars | Validation −13.7 bp (PF 0.83), test +12.4 bp (t 1.0) |
| D003 | Evidence | Rebound under four signal definitions | +31.8 / +19.1 / +21.4 / +64.8 bp per event, t 1.69 / 1.08 / 1.19 / 3.15 |
| S029 | Rejected | Transformer trained on simulated random orders, on Gold | +0.149 R per trade (t 2.09), but the same setups at random times give +0.104 R |
| S030 | Rejected | Pre-Fed drift on European indices | +18.0 bp before costs, the same move as US500 that night; +7.1 bp after costs (t 0.86) |
How it works.
Request access
Tick the strategies you want and send the form.
Go through the evidence
We reply by email and walk you through a full report on a call. Nothing to pay before that.
Get your workspace
Your strategies, their rules and their reports, ready and paper trading.
Decide on each signal
Signals reach you by Telegram or email. What you do with them is up to you.
Straight answers.
Will this make me money?
We can’t promise that. These are backtests and paper trades, and past results don’t predict future ones. CFDs are leveraged products that can lose money quickly.
Is any of this statistically proven?
No. Our own report card rates four of the five low trust: the backtest alone is not good evidence, so they are for paper or demo trading until new data confirms them. REBOUND-US-CASH rates medium. Every backtest check passes, but we picked it after looking at the data, and it still needs confirming on new data.
How much do I need to trade for this to be worth it?
Do this sum before you buy. In the backtest, REBOUND-US earned about 4.8 % a year on the amount traded and PRE-FOMC-US about 1.6 %, before leverage. Compare that with the price, and with a worst stretch of about 14 % for REBOUND-US.
Do you hold or trade my money?
No. ArchiBalt paper trades, and can send demo orders with virtual money. Any real trade is yours to place, at your own broker.
How often will I get a signal?
Rarely. Between 8 and 16 times a year per strategy, often in clusters, with months of silence in between. A strategy can go a long time without trading.
Which markets and which broker?
CFDs on US500, US100 and US30, tested on Capital.com’s hourly prices and spreads. Other brokers charge different spreads, which would change the results.
Can I see the research before paying?
Yes. We go through a full report with you on the call, before you pay anything.
Request access.
Tell us who you are and we’ll reply by email to arrange a call. There is nothing to pay until you’ve seen the evidence.
All 5 strategies
$10,000 a year
Indicative price for one year of access, confirmed on the call. Change your selection
Request sent.
We’ll reply to to arrange a call.